
Central tendency is a fundamental statistical concept often used to summarize data by identifying its central point. This helps in providing a ‘typical’ value for the dataset. There are three primary measures of central tendency: mean, median, and mode. Let’s dive deep into these measures and see how they can be calculated using R programming.
1. Mean (Arithmetic Average)
The mean is perhaps the most commonly known measure of central tendency. It’s the sum of all the values in a dataset divided by the number of values.
2. Median
The median is a dataset’s middle value when ordered in ascending or descending order. The median is the middle value if there is an odd number of values. If there is an even number of values, the median is the average of the two middle values.
3. Mode
The mode refers to the value(s) that appear most frequently in a dataset. A dataset can be:
- Unimodal: One mode
- Bimodal: Two modes
- Multimodal: More than two modes
- No mode: No value appears more than once
Example
Let’s take a closer look.
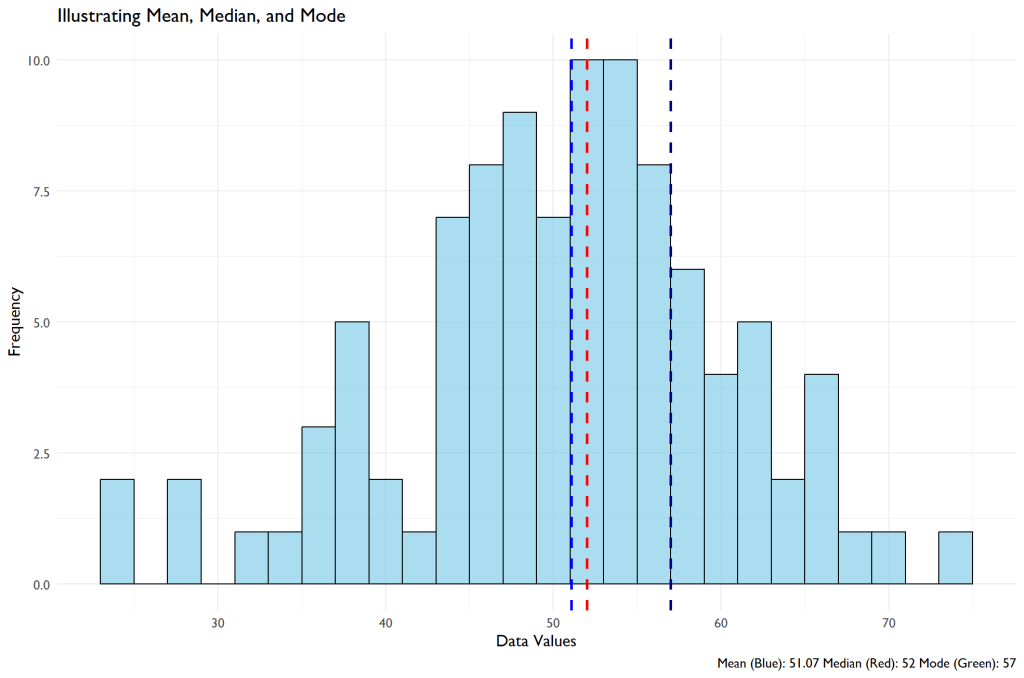
The visualization presents a histogram showcasing the distribution of a dataset comprised of 100 values generated from a normal distribution centered around the value of 50. The histogram bars represent the frequency of the data values. Higher bars indicate that more data points fall within that value range, while shorter bars indicate fewer data points.
Overlaying the histogram, we have three distinct dashed vertical lines in different colors, each representing one of the three measures of central tendency: mean, median, and mode.
- The blue dashed line represents the mean, which is the arithmetic average of the dataset. This line indicates where the “center of mass” of the data lies.
- The red dashed line signifies the median. As the data is sorted in ascending order, the median is the value that splits the dataset into two halves, ensuring that half of the data points are on its left and the other half on its right. It’s a valuable measure, especially when the dataset might have extreme values or outliers, as it remains unaffected and provides a more “central” value.
- Lastly, the green dashed line corresponds to the mode. It represents the value that appears most frequently in our dataset. Depending on the nature of the data, a dataset can have more than one mode or even no mode at all. In our visualization, the mode gives insight into the value around which the data seems to cluster the most.
Together, these lines provide a comprehensive snapshot of the dataset’s central tendencies. By juxtaposing these measures on the histogram, one can glean insights into the dataset’s spread, skewness, and general distribution shape and how each measure of central tendency relates to the overall data distribution.
Conclusion
Understanding the measures of central tendency can offer significant insights into the nature and distribution of your data. While the mean gives an average, the median provides a central value, and the mode identifies the most common value(s). Knowing how to use and interpret these measures is essential for anyone working with data.