Data analysis is at the heart of decision-making, and community practitioners strive to harness the power of information to improve their communities. However, relying solely on summary statistics can sometimes lead to misleading conclusions. Enter Anscombe’s quartet, a fascinating set of datasets that challenges our assumptions and reminds us of the significance of data visualization. Understanding how community practitioners can utilize it is crucial to enhance critical thinking and drive informed decision-making.
The Quartet’s Tale: An Intriguing Introduction
To start our exploration, let’s acquaint ourselves with Anscombe’s quartet. Composed of four datasets, each carefully crafted to exhibit similar statistical properties, the quartet offers a unique perspective on the complexities of data analysis. We’ll delve into the quartet’s background, understand its creation, and recognize its purpose as a tool for data exploration.
Visualizing Data: Beyond the Numbers
Numbers alone can tell a story but might not reveal the whole truth. Anscombe’s quartet emphasizes the importance of visualizing data through various graph types. From scatter plots to line graphs, we’ll discover how different datasets within the quartet can produce drastically different patterns, challenging our preconceived notions and highlighting the need for visual exploration.
Anscombe’s quartet is a set of four datasets with nearly identical descriptive statistics but display strikingly different distributions when graphed. The statistician Francis Anscombe created the quartet in 1973 to illustrate the importance of visualizing data in addition to relying on summary statistics. Each dataset consists of 11 pairs of x and y values, representing different experiments or observations.
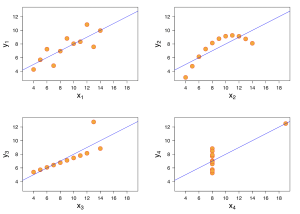
Anscombe’s quartet serves as a powerful reminder that relying solely on summary statistics such as mean, standard deviation, or correlation coefficient can be misleading. It highlights the importance of data visualization to gain a deeper understanding of the underlying patterns and relationships within the data. The quartet challenges the notion that a single set of summary statistics can fully capture the complexity of real-world data and emphasizes the need to explore and interpret data visually to avoid oversimplification and misinterpretation.
Teaching Statistical Concepts: Bringing Data to Life
Anscombe’s quartet serves as an invaluable resource for teaching statistical concepts. By using the quartet as a teaching tool, community practitioners can engage learners in hands-on activities, exploring mean, variance, correlation, and regression analysis. Through interactive exercises and real-life examples, practitioners can empower community members to grasp statistical concepts effectively.
Igniting Critical Thinking: Unmasking Assumptions
In a world driven by data, critical thinking is paramount. Anscombe’s quartet encourages us to question assumptions and think critically about the information we encounter. By presenting the quartet’s datasets side by side, practitioners can prompt community members to analyze and interpret the data independently. Engaging in discussions about the limitations of summary statistics and the role of visual representation, community members can cultivate a deeper understanding of data analysis.
Validating and Assessing Data: Unveiling Hidden Stories
Data validation is an essential step in the decision-making process. Anscombe’s quartet can be a powerful tool for practitioners to assess the accuracy and reliability of datasets. By comparing a given dataset to the quartet, practitioners can determine if the summary statistics align with the visual representation. This validation process unveils potential anomalies, highlights the need for further investigation, and ensures informed decision-making.
Fostering Open Discussions: A Community Journey
Data analysis is not a solitary endeavor; it thrives on collaboration and open discussions. Anscombe’s quartet can serve as a catalyst for dialogue within communities. By sharing the quartet and encouraging community members to explore and compare the datasets, practitioners create an environment for exchanging ideas, challenging assumptions, and collectively working towards data-driven solutions.
Anscombe’s quartet is a captivating tool that invites us to question, explore, and reimagine the world of data analysis. Community practitioners can leverage its power to promote critical thinking, enhance statistical literacy, and drive informed decision-making within their communities. By embracing the quartet’s lessons, we unlock a deeper understanding of the complexities that lie beneath the surface of summary statistics. So let’s embrace the quartet and embark on a journey to unleash the true potential of data in shaping vibrant and thriving communities.