In our work for the RISE project, we have been looking at how different organizations have used Twitter to spread public health messages. These organizations aren’t the only ones with an interest in trying to communicate with the public at large. Government officials have a vested responsibility that involves being able to directly communicate news and opinions to their constituents.
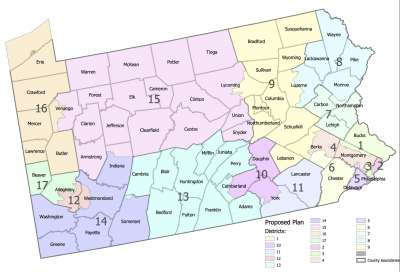
We’ve already developed a basic app over at rmc2.org that examines single accounts or hashtagged trends. In this blog, we do more of a comparative analysis by examing the Twitter accounts of all 18 PA Congressional representatives.
Why Twitter?
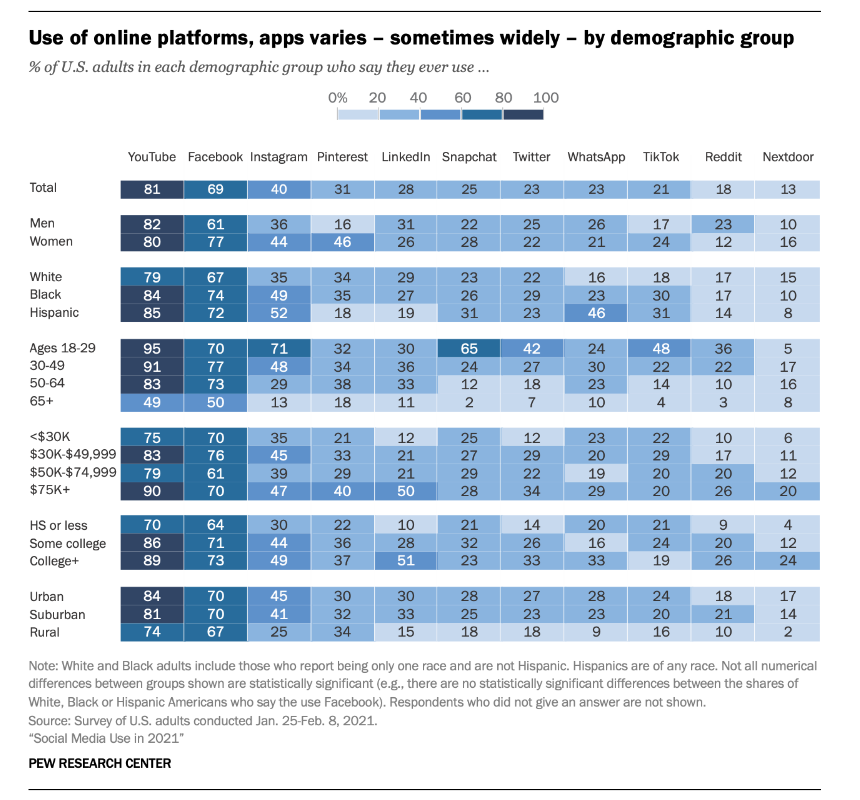
The Pew Research Center has reported that Facebook remains the 2nd* most heavily trafficked social media platform. (We can quibble about whether YouTube is actually social media or some other format). And it’s clear that Facebook and other Meta-platforms far outnumber Twitter use. So, why do we focus on Twitter?
The biggest reason is that the Twitter API is easy to work with. We can get a lot of really useful data with a very small amount of coding and data cleaning. This makes studying Twitter much more accessible than other platforms, which have really locked down in the wake of the Cambridge Analytica scandal. There are some manual ways to get at social media data, such as scraping Linkedin profiles, but nothing rivals the Twitter API in terms of ease of use.
With nothing but a few lines of code for retrieval (and then several hundred lines of code for the analyses), we can get a good sense of how the PA representatives compare to one another. So, let’s start with some visuals.
Bag of Words: What people say
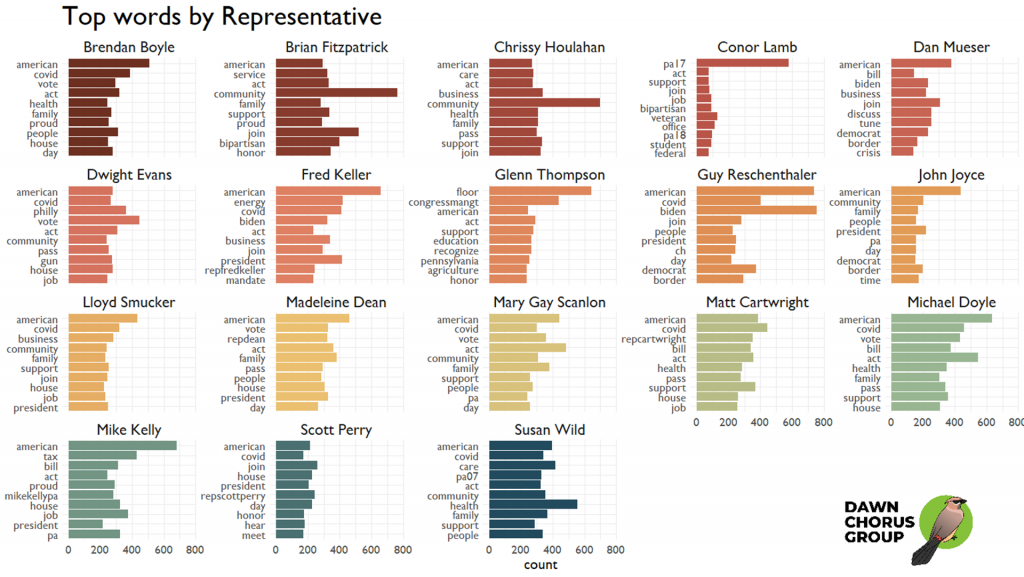
The bag of words method treats each individual word as meaningful. Therefore, if a word is used very frequently, it is likely to be pretty important. However, we want to cut out stopwords. These words add little information value, like and, the, and very.
So looking at this first figure, we can see the words that show up the most in each representative’s feed. I didn’t break this down by party yet, because we’re not interested in those group-level differences at this stage. Some common pattern we see is that the words American and Covid show up a lot. Surprisingly, only two representatives refer to their district by name in their top ten words.
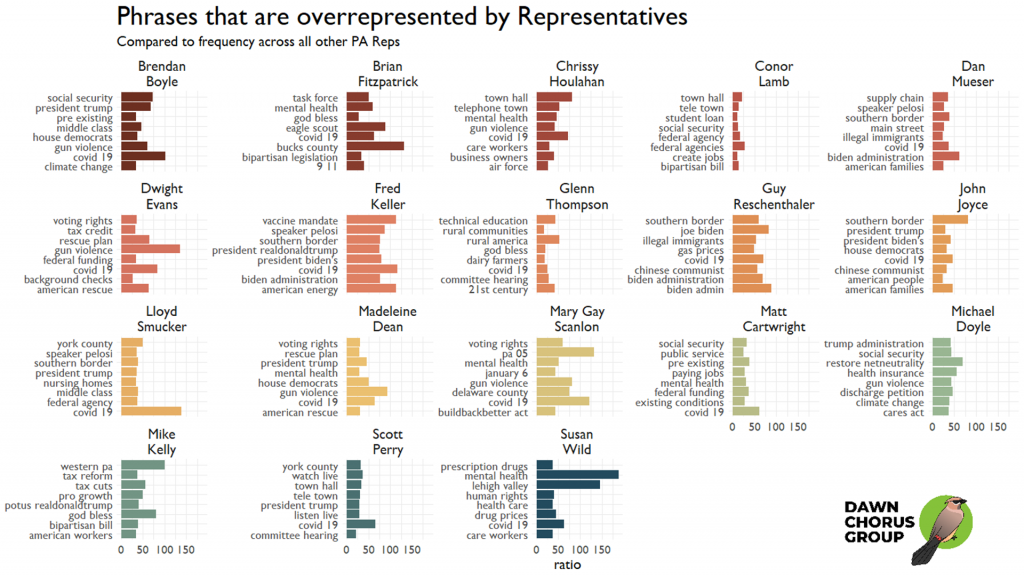
I next looked at the uniqueness of the representative. To do this, I identified two-word phrases (sometimes called bigrams) that were overrepresented in a Twitter feed, as compared to all the other representatives. This is a much more informative analysis because we can begin to see the contours of important topics to the representatives. For example, we can see Susan Wild tweets a disproportionate amount about mental health, prescription drugs, and drug prices. Glenn Thompson talks more about rural issues. And Mike Kelly talks more about tax-related issues.
Sentiment Analysis: The emotions that words convey
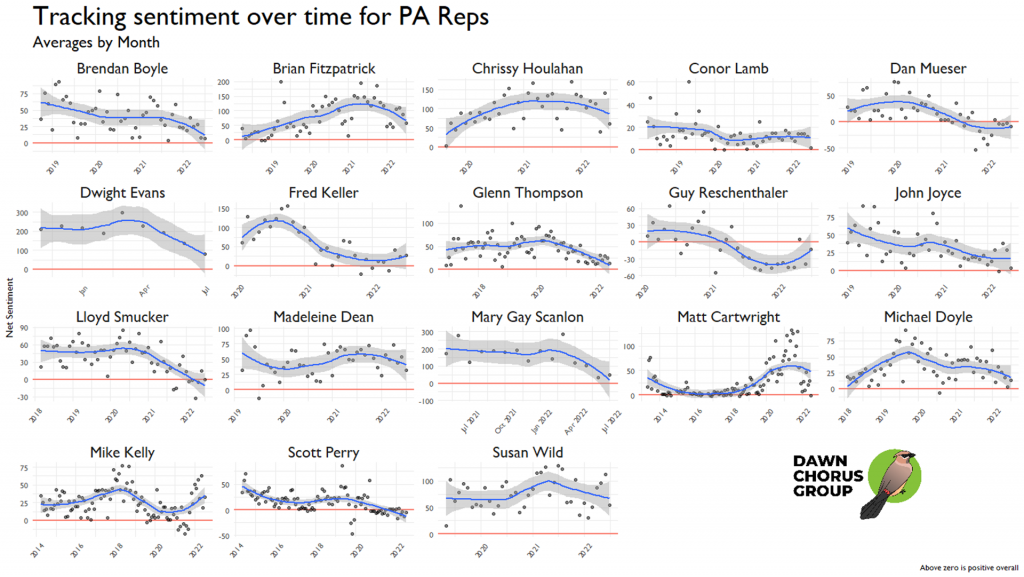
Words don’t just convey semantic meaning. They can also convey emotional content. This is basis of sentiment analysis, which uses prelabeled dictionaries to code words according to general valence (positive or negative) or a specific emotion. I averaged the sentiment of all tweets for each month, then plotted these along with a trend line. The below graph shows how each representative fluctuated over time, along with their absolute scores. We can see that Guy Reschethaler’s tweets come across as pretty negative. And that Brian Fitzpatrick and Dwight Evans are pretty positive guys.
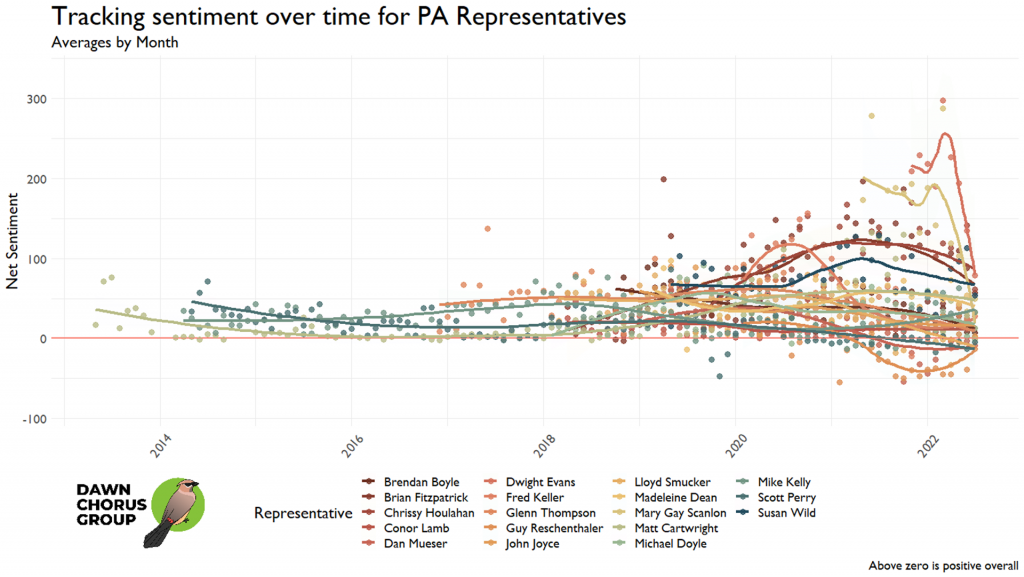
But, because the scales for each of these graphs are different, it’s a little tough to compare them. I plotted them all onto the same graph so the timelines and absolute valence sync up. The graph is crowded, I know. It’s hard to find 18 distinguishing colors. What this does show us is that Dwight Evans and Mary Gay Scanlon are our most positive tweeters, though with a clear recent downward trend. Matt Cartwright has had a Twitter account for the longest and has been pretty steady over that time.
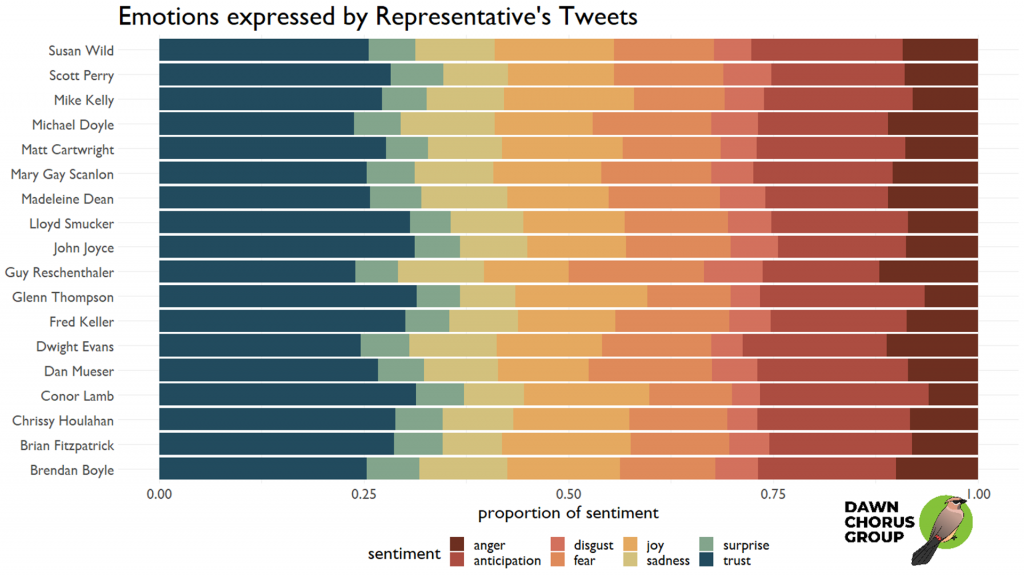
Using a different lexicon (i.e., a precoded dictionary of words), I looked at the proportion of tweets that fall into various emotional categories. Because this is more nuanced data, it’s a little harder to spot distinguishing trends, though we can see that Guy’s tweets have a higher proportion of anger and a smaller proportion of trust. Guy also seems to reflect fear the most.
Using Tweets to Predict Engagement
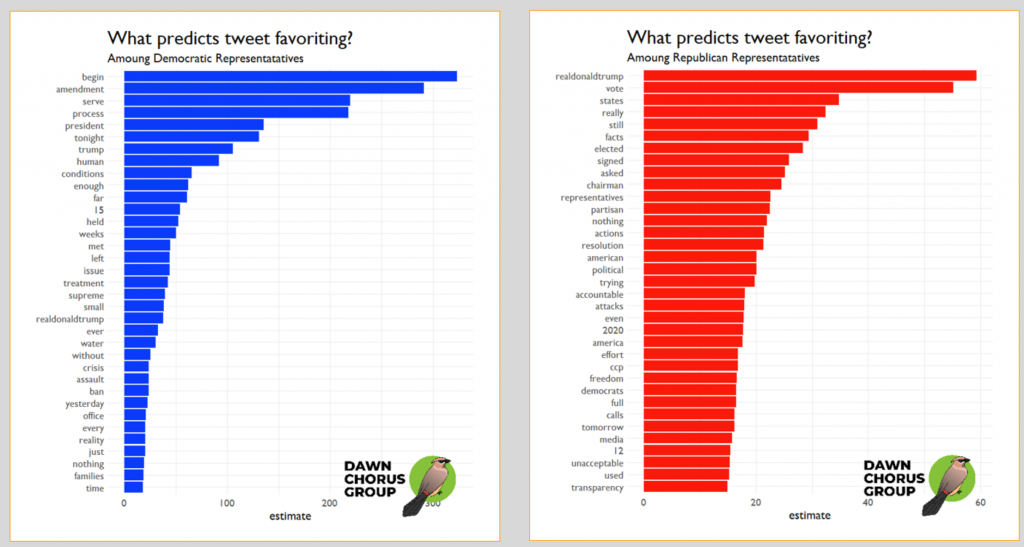
Thus far, we’ve only looked at descriptive features of tweets. But, we can also use the text to see if we can predict how much engagement a tweet will generate. To do this, I ran a simple linear machine learning model that predicted likes and retweets as a function of the top 1000 words used and the accounts’ overall number of followers (as a covariate). For this analysis, I did separate out by party to see whether different messages were more likely to resonate with followers. There’s an interesting, untested assumption here. Are followers of a representative more likely to be of the same party, or just residents of a district. I follow my Rep, even though we are of different parties (and consequently, I’m not one to engage with his tweets).
There are two main types of engagement: favoriting and retweeting. When we look at favoriting, we can see clear differences between the parties. Mentioned the former president was worth up to 60 favorites among the Republican reps. Biden doesn’t even show up by name in either parties’ top 30 words. The context behind “begin” and “amendment” is unclear, but these words are worth around 300 favorites for Democrats.
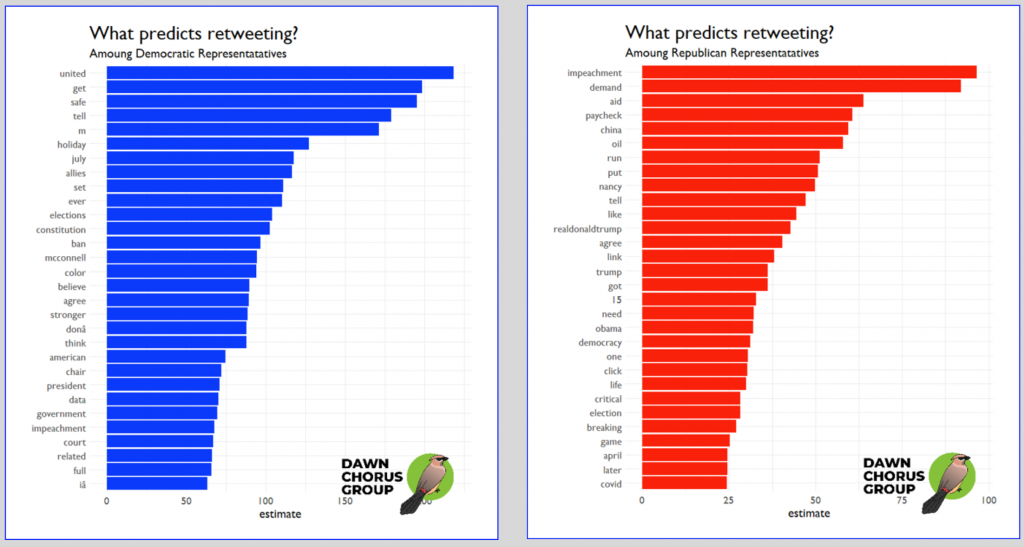
Looking at retweeting, we see a really different set of words. This is interesting in and of itself. The words that encourage people to share differ greatly from those that promote affirmations.
Making these results actionable
Okay, say you’re a Democratic rep. Could you get a lot of traction by posting something like, “This holiday, get safe and stay united with our allies?” Probably not. These models are predictive, not prescriptive. But, they do show us some interesting patterns in how the reps use Twitter, and suggest some ways in which they might improve.
Play around yourself
Head on over to RMC2.org to use our free Twitter bot to get information about different hashtags and accounts. It’s free and fun! And, if you’re interested in us doing a more detailed analysis like this for you, reach out to us via the contact form or on any of our social media platforms.