Well, we finally did it.
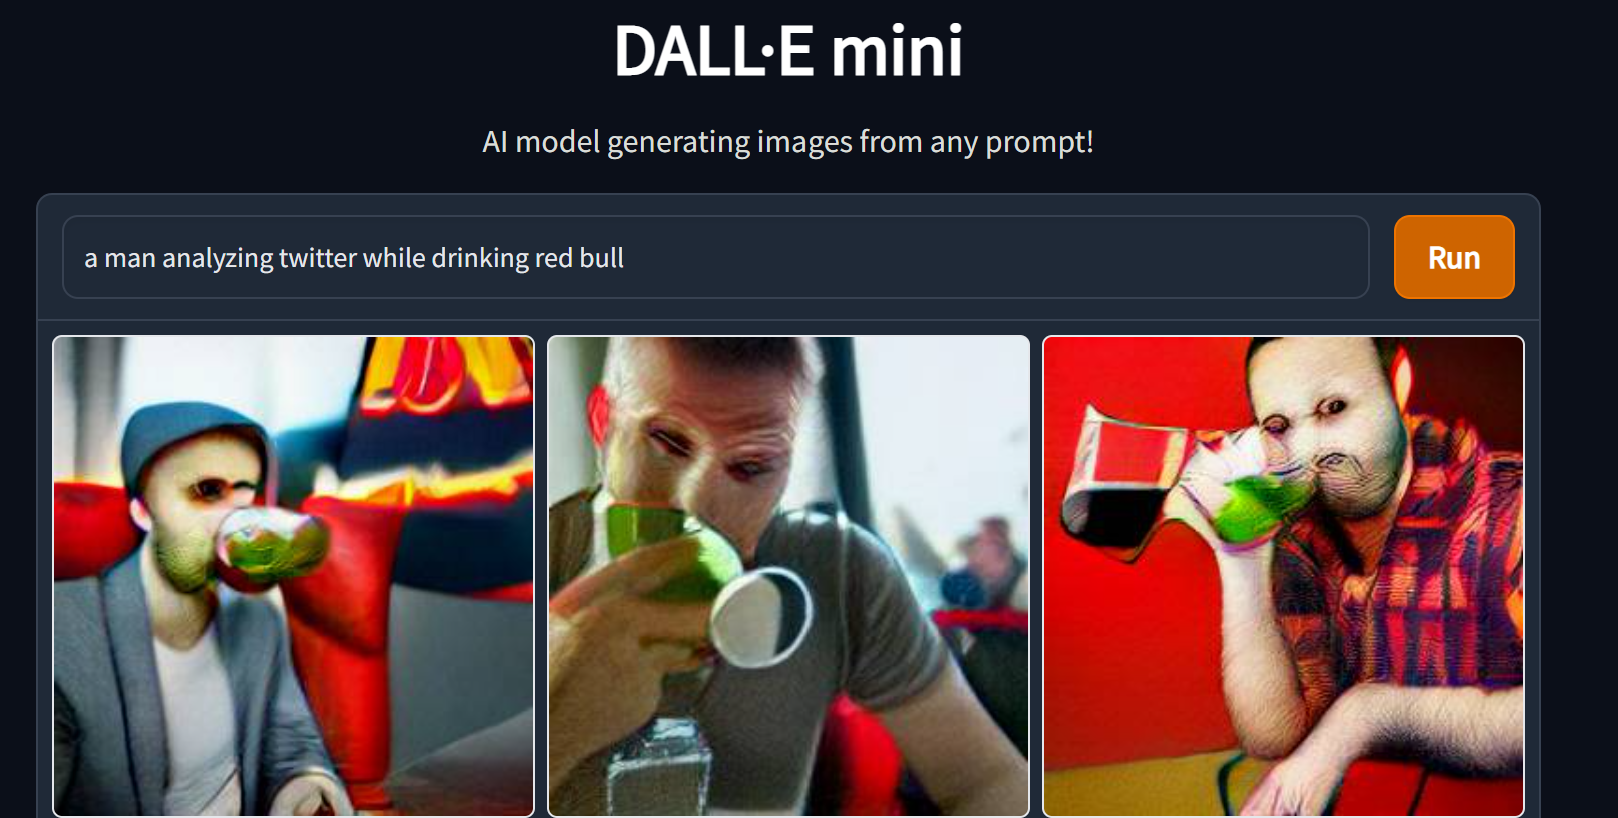
We launched a beta version of Readiness Learning Systems. So far, we only have two apps up there, which are designed to help you analyze and learn from Twitter data. What you can do is either enter a hashtag or a full account (like @waitbutwhy, for example), and we’ll process some themes and trends in the data using some NLP techniques like bag-of-words and sentiment analysis.
Go here to start playing around. It’s free. Totally free!
And yes, this is a beta version, so there are bound to be some bugs. If too many people are using it at the same time, the pipeline will get throttled and you’ll have to wait about 15 minutes. Otherwise, if you find any reach out to meghan@dawnchorusgroup.com. We’ll be tweaking and improving this as more people tell us what’s useful, so….tell us what’s useful.
But there’s more
We’ll be starting to host semi-regular webinars around analyzing and interpreting social media data throughout the summer. Here at Dawn Chorus, we’re able to do some sophisticated things that can help you better understand messaging that works and that doesn’t.
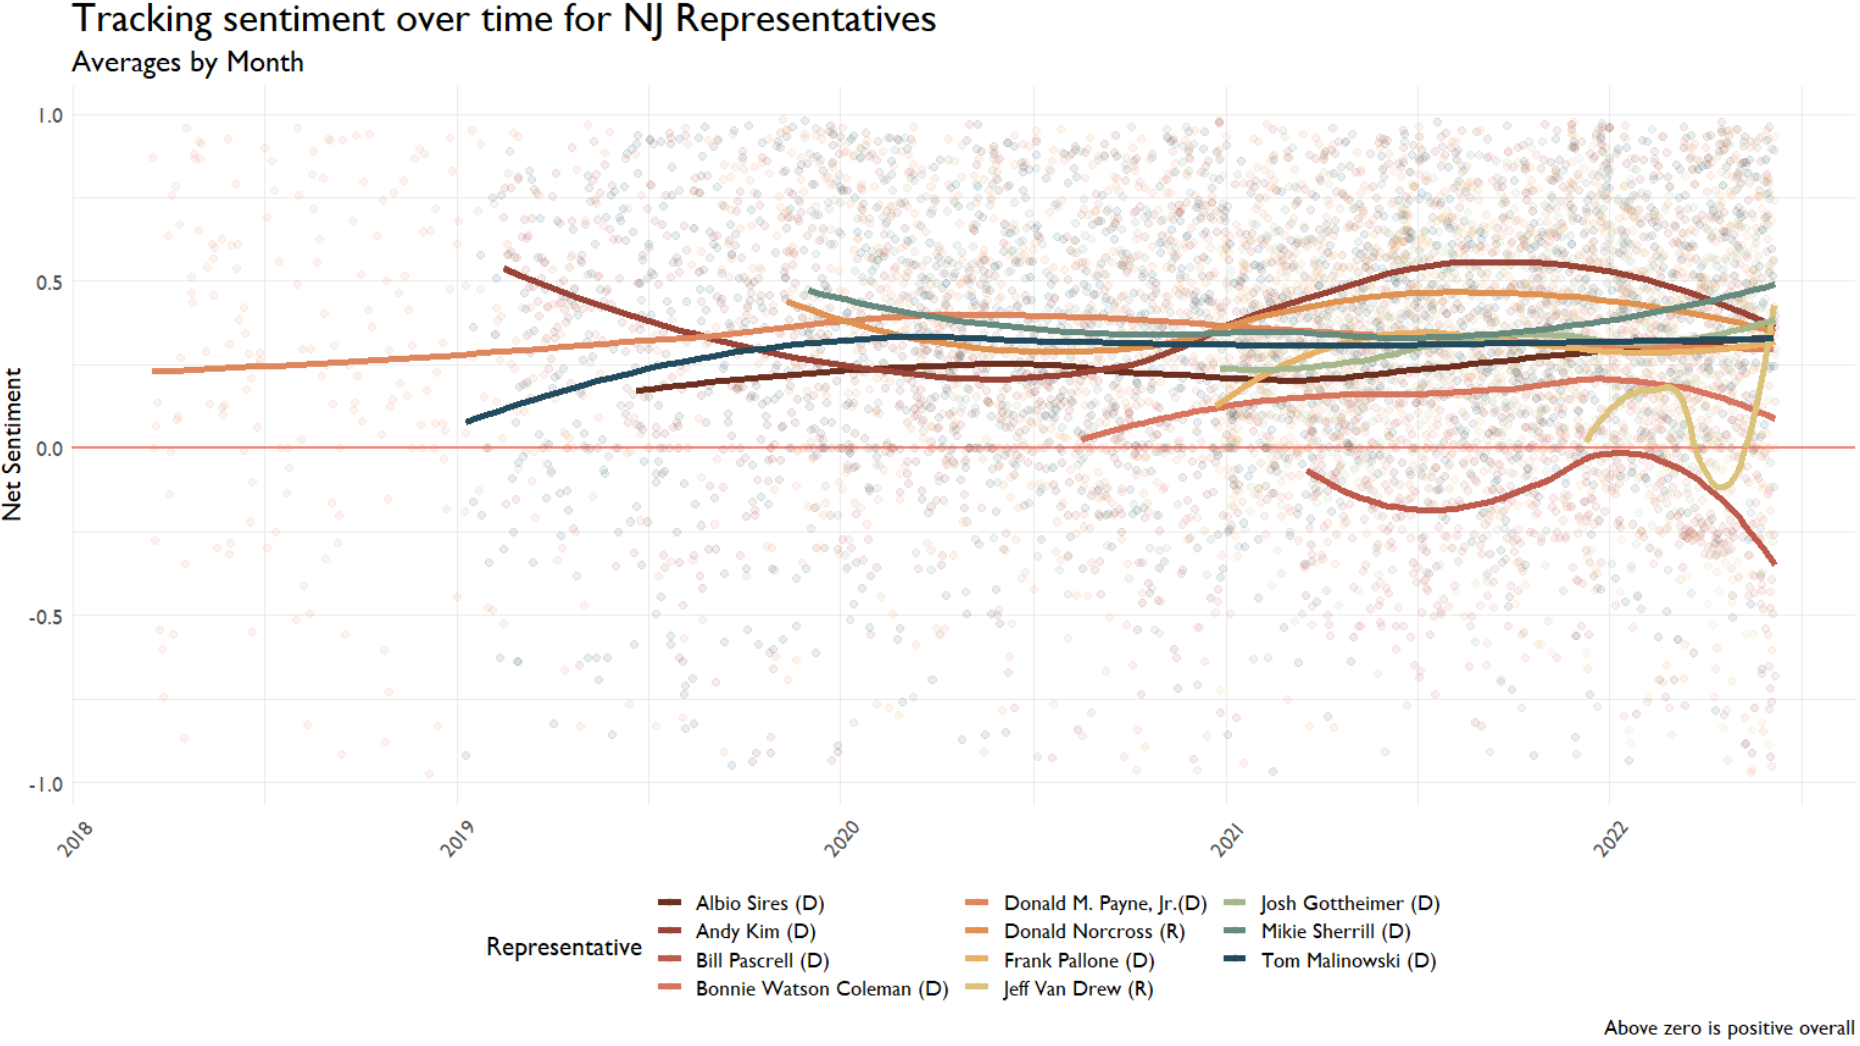
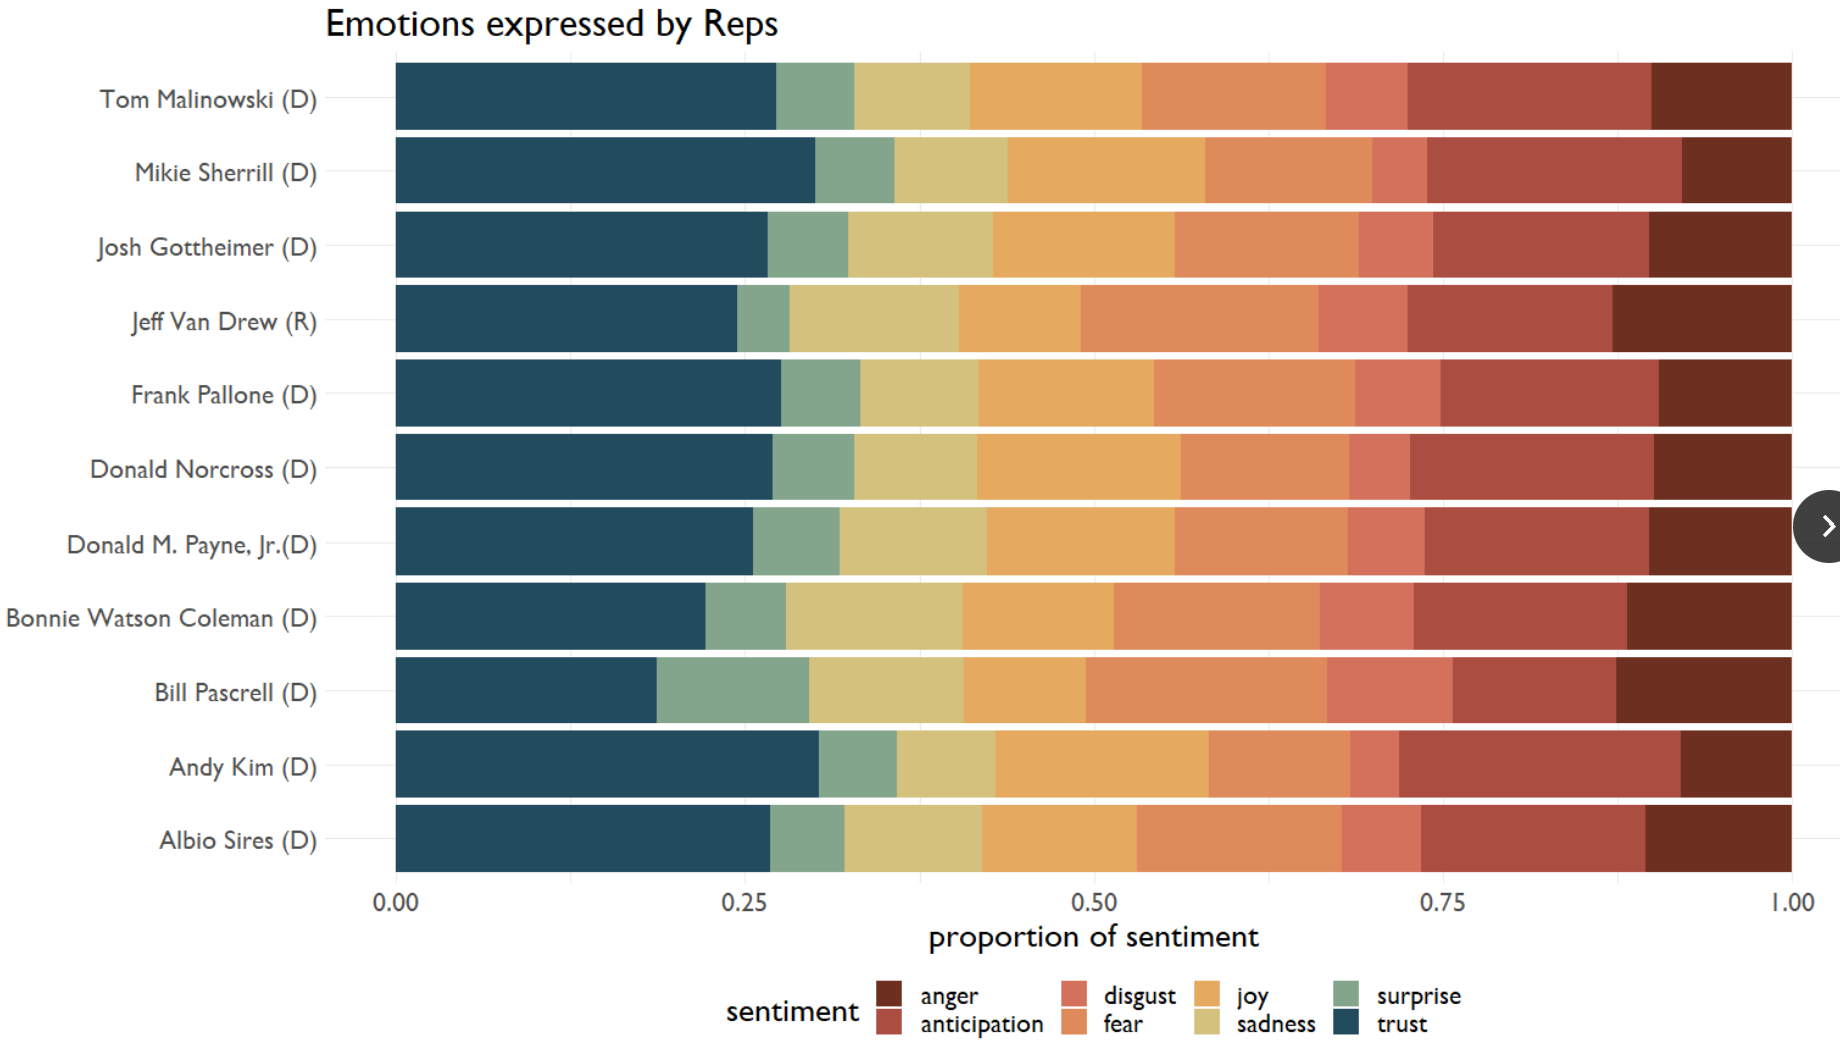
We can also compare across accounts. Here’s a snapshot of some fun stuff we recently did look at all the US Representatives in New Jersey.
Want to dive deep?
Reach out to us and we can help you explore all across the Twitterverse.