
Far be it from me to throw the first stone. I can get sloppy sometimes, so I’ve learned to make sure someone who is NOT ME checks my work before it goes out. When I skip that step, which sometimes I do out of urgency, I inevitably find some incredibly stupid error I should have caught.
This is all to say that errors happen. However, sometimes, errors look less like mistakes and more like unnecessary shortcuts. And depending on the magnitude of those errors, they can look irresponsible.
Exeter Police Data
When I worked for the Department of Health and Human Services in DC back in 2014, there was a large security breach. Because of that, the government provided a somewhat indefinite identity monitoring service. As part of these emails, I always get the latest sex offender report. This is publicly available data, which you can find here.
So, I was interested in other crime metrics here in my backyard. There are two sources to pull this data from. The first, and most comprehensive is PA’s Uniform Crime Reporting System. This reports on a variety of crimes going back to 2000 in Exeter. It’s a straightforward process to pull this data, so let’s look at what UCR says about Exeter crime over the last 25ish years.

The blue lines are called “loess” lines, which are basically a fancy trend line. There are some interesting trends here. Larceny, motor vehicle theft, and robbery have dropped significantly over the past twenty years. There’s also a lot more arson than I would have guessed.
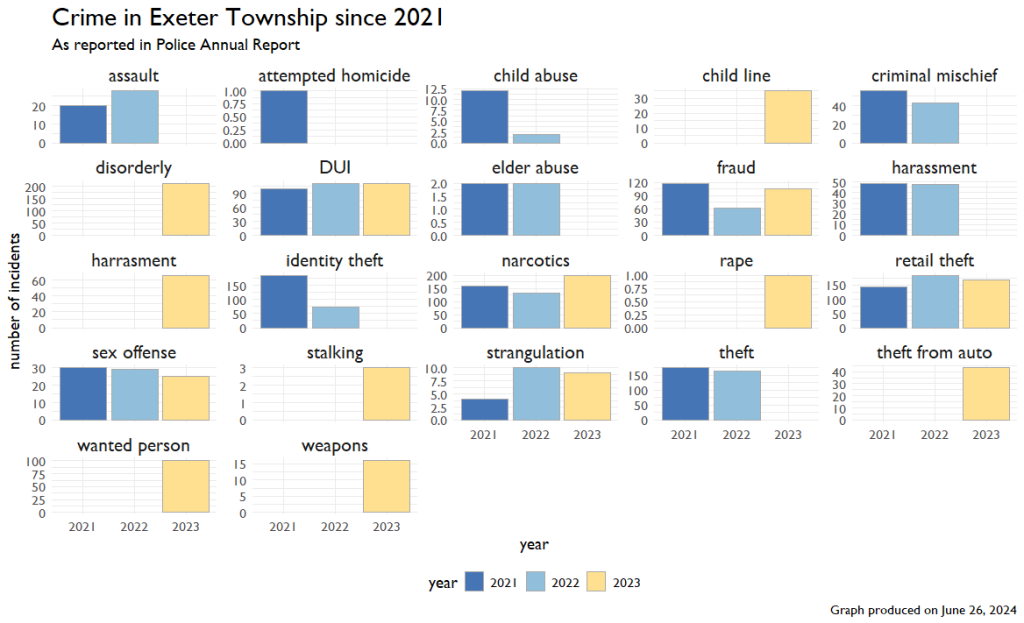
Now, Exeter Police puts out Annual Reports. You can get the last three at this site. I couldn’t find any other one doing some internet sleuthing, so this is the data we have to work with. The police report crime somewhat differently. Instead of having the same crimes from year to year, they report “Notable” crime, which is further categorized into three buckets: Crimes, Incidents, and Traffic.
The bucket of Crimes most aligns with the UCR data, so we’ll take a look at that first. Trend lines aren’t really appropriate here because we only have three time points, and the same crimes aren’t reported each time.
We can now combine the data between sets to check to make sure what Exeter is reported aligns with the UCR and vice versa. It’s tricky because the UCR only reports a few crimes, and the Annual reports may label them differently, but we can try.
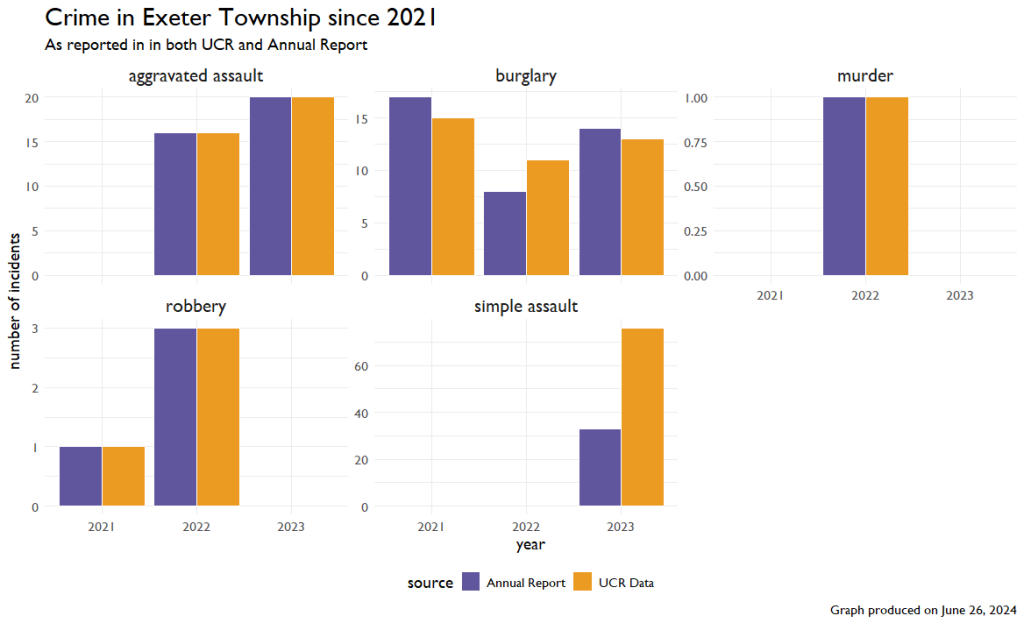
Across these five categories of crime, things line up okay. There are pretty big discrepancies between simple assault and burglary, but we might be able to chalk that up to labeling in the reports. What I find a bit more disconcerting is what is NOT in this graph. The UCR reported one rape in 2021 and two rapes in 2022. For whatever reason, these were left out of the Annual Reports.
Incident Data
So there are two more buckets of data that we should look at: Incidents and Traffic. From my reading of the report, Incidents appear to occur when an officer is deployed to a scene. Again, we only have three time points, but we can see the types of situations the police are involved in.
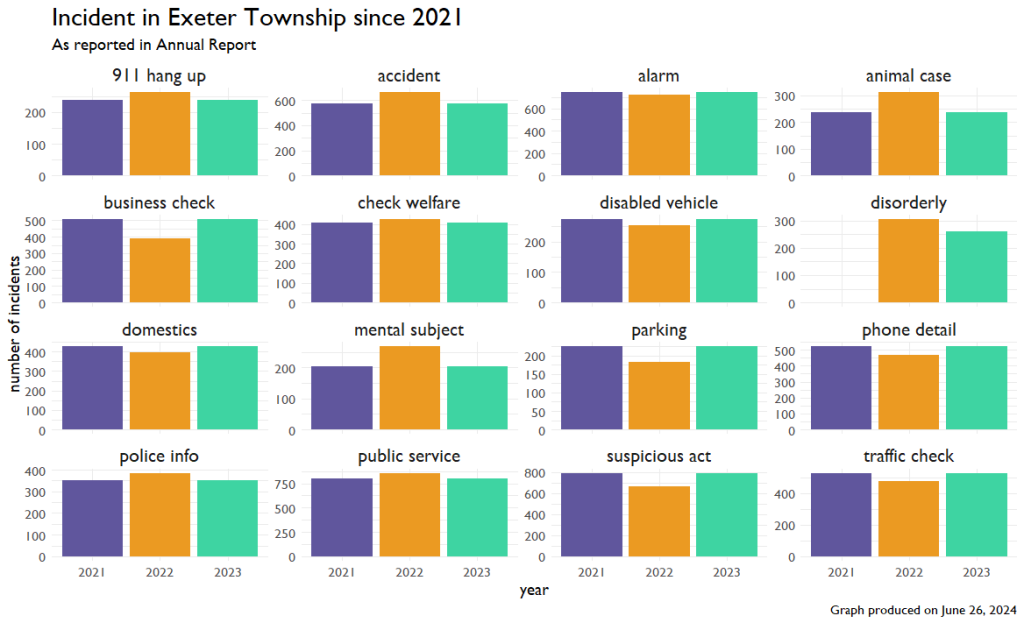
These numbers all look really consistent, so instead of raw numbers, I decided to look at percent change from year to year. In the graph below, each bar represents a year-to-year change. If the bar is red, that’s bad. That means incidents are going up. If it’s green, that’s good. It means incidents are going down.
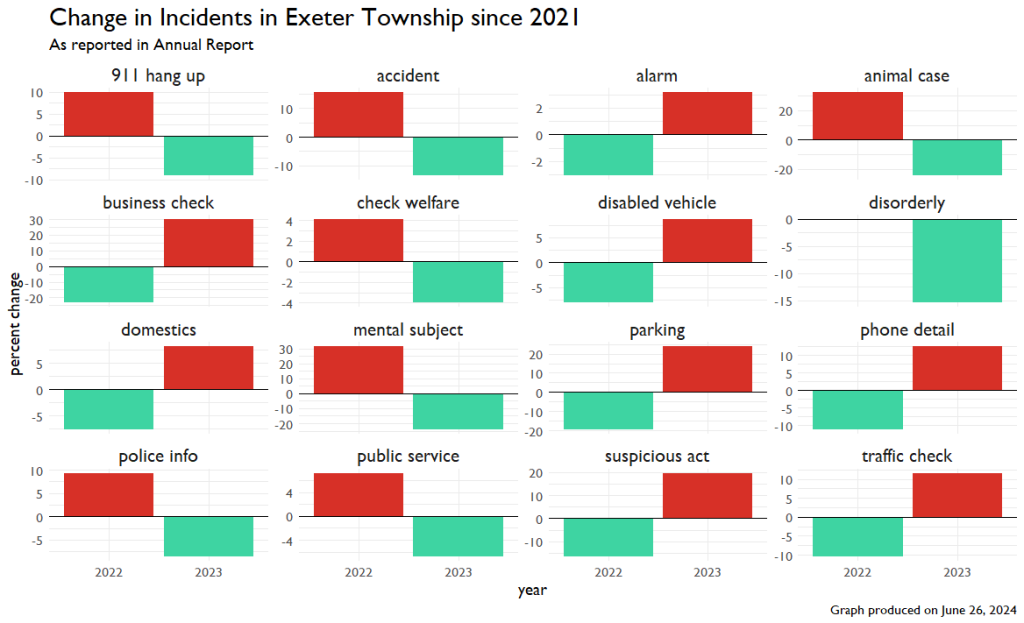
But this graph looks weird. In a few instances, it almost looked like mirror images. I noticed some numbers seemed similar when I was entering the data, so I decided to look at just the change in incidents from 2021 to 2023, with 2022 excluded. This is what I found.
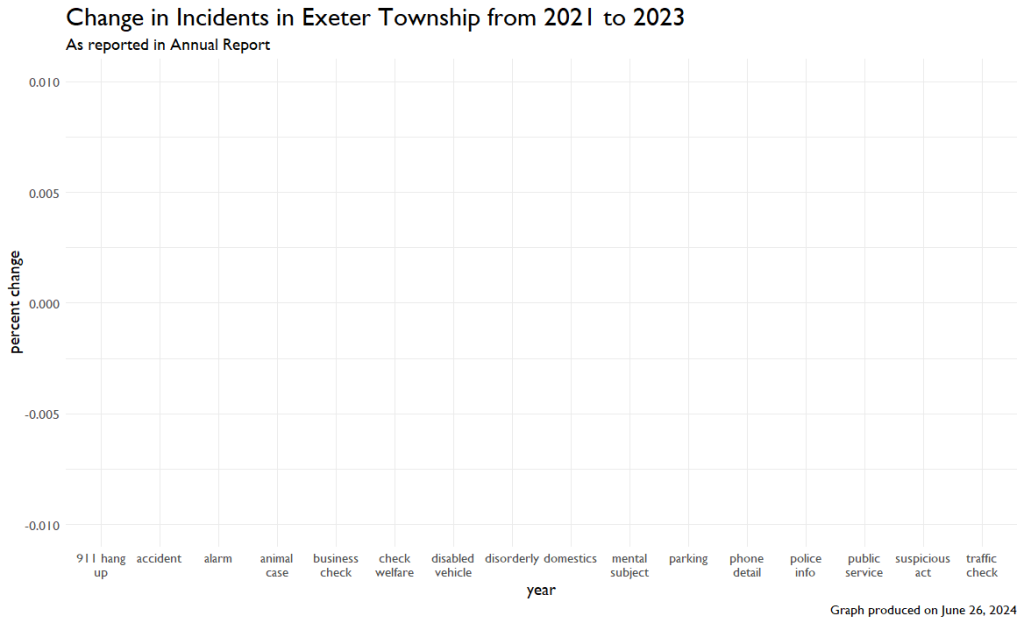
This isn’t a mistake. The values for these incidents in 2021 and 2023 are EXACTLY the same. I’ll include the code and the output at the end of this article.
So what are we supposed to make of this? This isn’t a typo. And, it isn’t a case of someone being sloppy and forgetting to update a template they were previously using since the 2022 values ARE different.
I guess what I’m saying is even I’ve never made a mistake that big.
Traffic
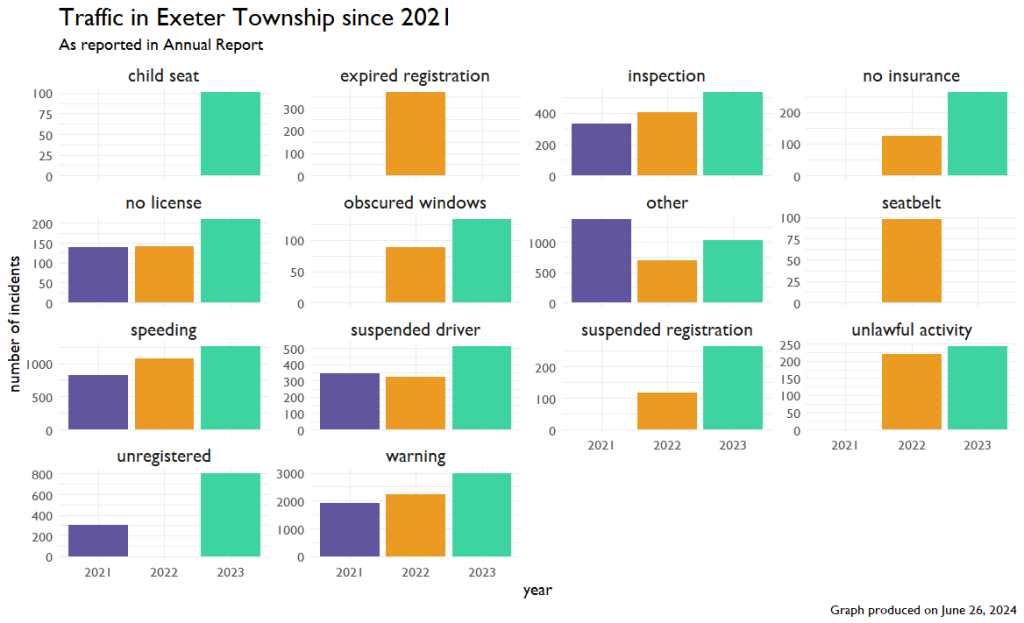
As a kind of coda, you’ll remember there was a third bucket of data: Traffic. I used similar methods as above to look at the raw numbers of violations and changes over time.
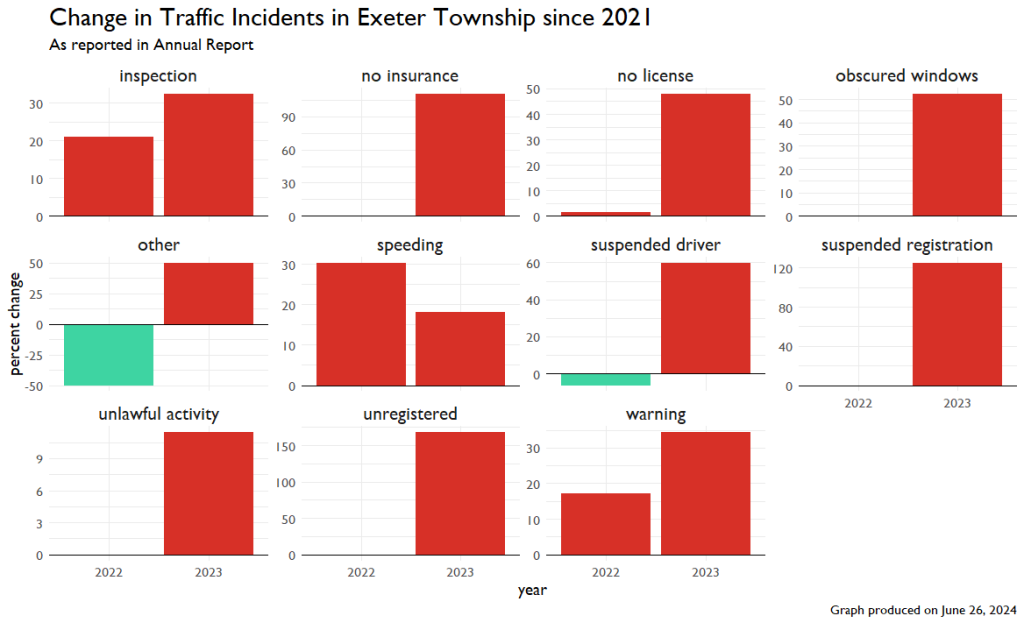
Looking at the change from year to year, I see that it seems more reasonable.
Conclusion
What’s there to say except: don’t cut and paste, especially when you’re in a position of public trust.
Appendix
The code showed identical values.
> df1 %>%
+   filter(is.na(ucr_data)) %>%
+   filter(grepl("incident", incident)) %>%
+   filter(year != 2022) %>%
+   arrange(type, year) %>%
+   group_by(type) %>%
+   mutate(percent_diff = (number - lag(number)) / lag(number) * 100) %>%
+   print(n=31)
# A tibble: 31 × 6
# Groups:   type [16]
    year incident type             number ucr_data percent_diff
   <dbl> <fct>    <fct>             <dbl>    <dbl>        <dbl>
 1  2021 incident 911 hang up         240       NA           NA
 2  2023 incident 911 hang up         240       NA            0
 3  2021 incident accident            576       NA           NA
 4  2023 incident accident            576       NA            0
 5  2021 incident alarm               748       NA           NA
 6  2023 incident alarm               748       NA            0
 7  2021 incident animal case         236       NA           NA
 8  2023 incident animal case         236       NA            0
 9  2021 incident business check      509       NA           NA
10  2023 incident business check      509       NA            0
11  2021 incident check welfare       410       NA           NA
12  2023 incident check welfare       410       NA            0
13  2021 incident disabled vehicle    275       NA           NA
14  2023 incident disabled vehicle    275       NA            0
15  2023 incident disorderly          259       NA           NA
16  2021 incident domestics           430       NA           NA
17  2023 incident domestics           430       NA            0
18  2021 incident mental subject      205       NA           NA
19  2023 incident mental subject      205       NA            0
20  2021 incident parking             227       NA           NA
21  2023 incident parking             227       NA            0
22  2021 incident phone detail        525       NA           NA
23  2023 incident phone detail        525       NA            0
24  2021 incident police info         353       NA           NA
25  2023 incident police info         353       NA            0
26  2021 incident public service      800       NA           NA
27  2023 incident public service      800       NA            0
28  2021 incident suspicious act      792       NA           NA
29  2023 incident suspicious act      792       NA            0
30  2021 incident traffic check       528       NA           NA
31  2023 incident traffic check       528       NA            0